Pargesoft SOH Dashboard
Find clarity with Power BI-SOH (Sales on-hand) dashboard when you need it most. Empower team members to discover insights hidden in your data with Microsoft Power BI.
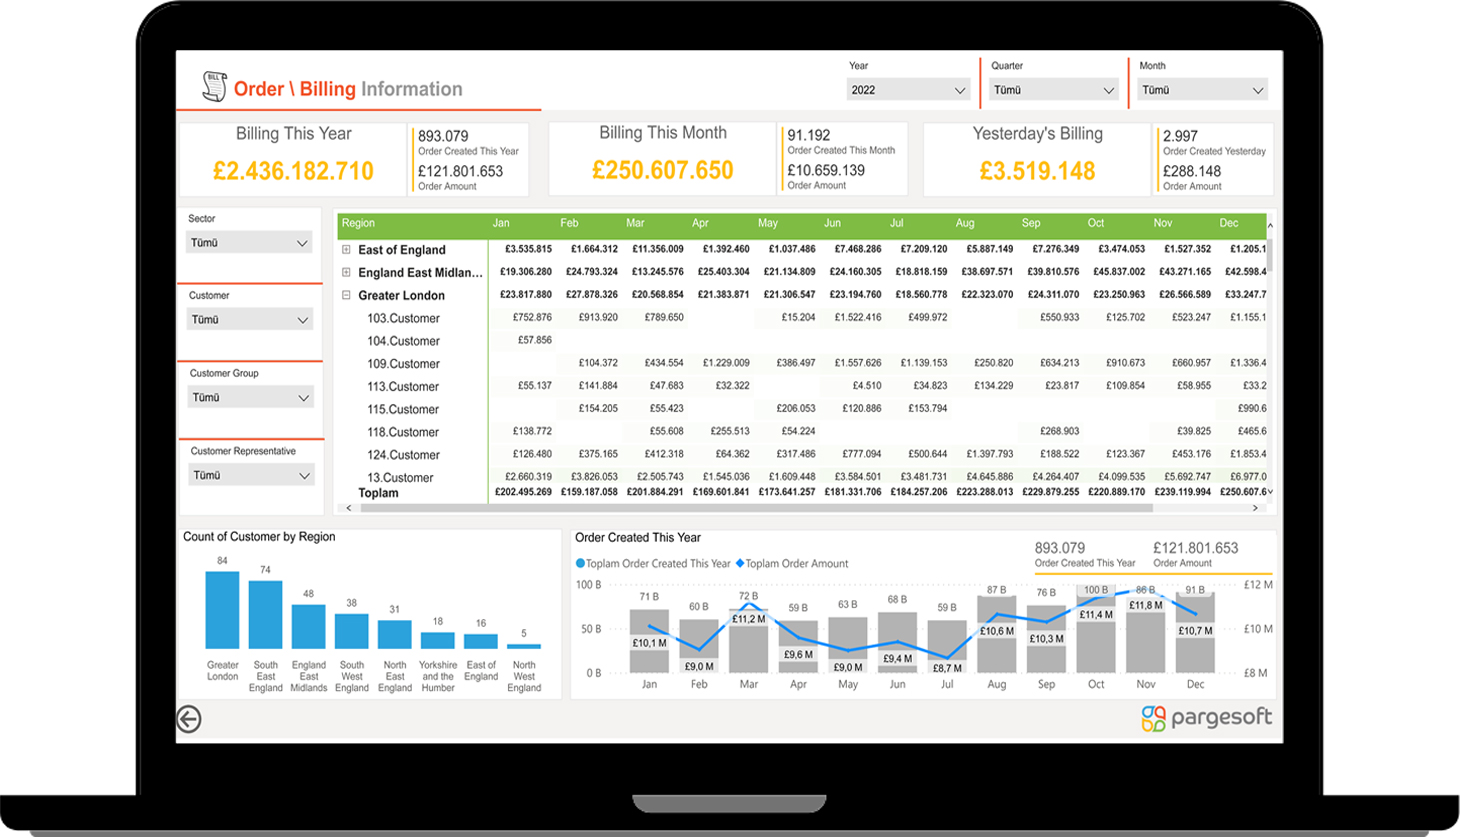
Order & Billing
Financial Business Ratios; Along with Income Statement and Balance Sheet Analysis, it gives you a great way to visualize and interact with Cash Flow Analysis and high-level financial data. Comments are crucial to financial reporting, as financial reports are often handed over to senior management, whose choice is comments. They need brief explanations explaining what's going on in these reports. The scope here is to prepare the hierarchy of your accounts such as product income, service income, gross profit margin. It analyzes all major Financial KPIs such as Profit and Loss, balance sheet figures such as income/expenses, assets and liabilities, cash flow metrics and more through a range of Finance analytics indicators and assists in making more clear financial decisions.

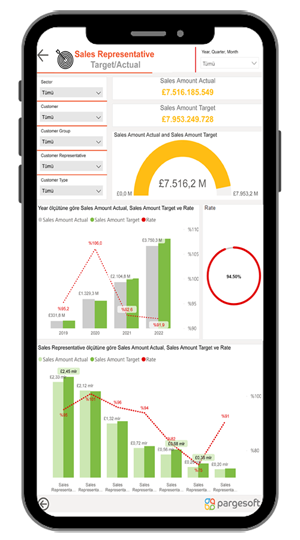
Sales Representative Target Actual
This is a highly detailed sales scorecard board for sales teams. Helps answer basic questions a Sales Manager might ask. The aim here is to see the sales by product/region/state, on a month/period and vendor basis, and to take actionable decisions. It was built on the data of questions that what we sell (product, service), where/where do we sell (region, state), time periods (month, year), who sells (salesperson). It has been prepared to enable you to make decisions that are based on sales processes but that will also affect marketing and financial progress.
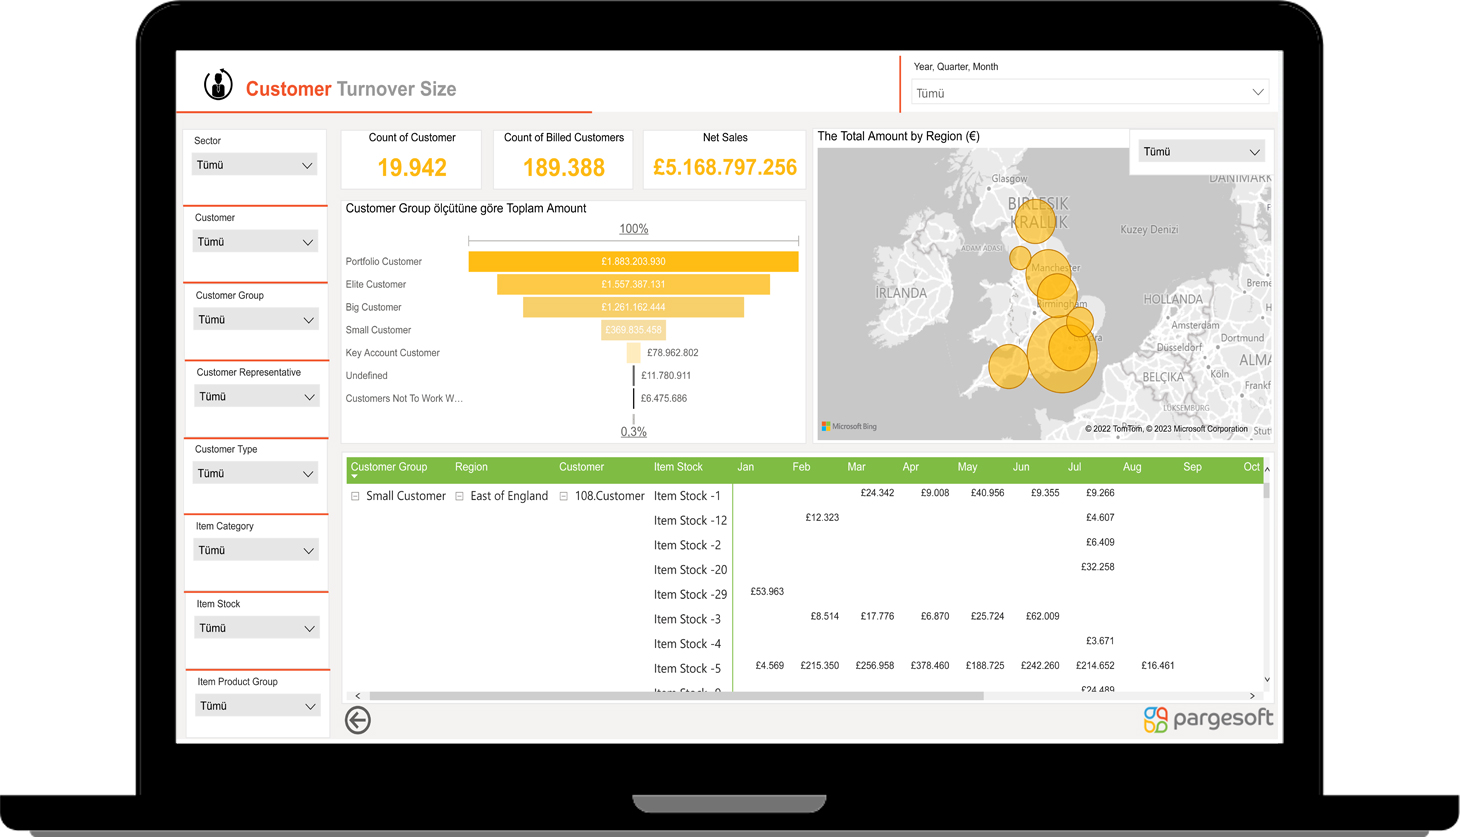
The customer analytics dashboard was created to better understand the demographics of their customers and how these attributes affect your company's customer relationships. The goal is to help you understand which types of customers are more valuable and which are bigger in terms of turnover. These insights allow your business to focus on customers with a higher return on investment.
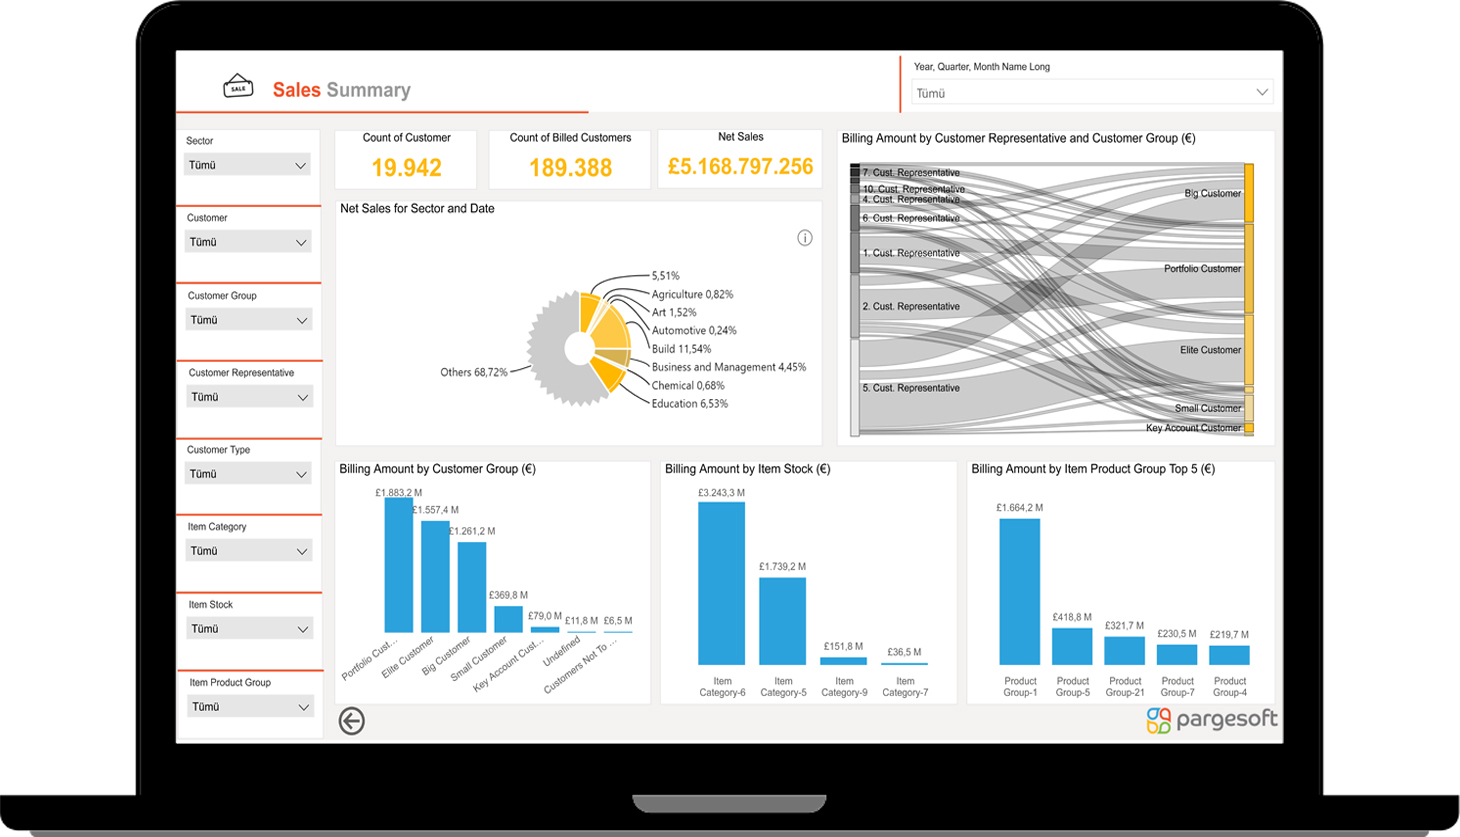
It is created to help Sales managers visualize opportunities, sales potential, current sales data. The goal is to help sales managers understand how the business is performing and where they should focus their efforts to meet sales goals. The dashboard provides sales managers with an overview of their sales to date, with details on each opportunity. In addition, all metrics are presented in a high-level format to help sales managers identify areas of focus.
This is ideal for checking your Finances and getting an overview of your total income and expenses. Here, the goal includes key key indicators that help management make decisions using data based on insights. It shows an overall comparison of Income by month, location, time period; total revenue by departments, month and period; sales and expense details; money flow, income and expense in cash, credit and bank accounts through graphs.
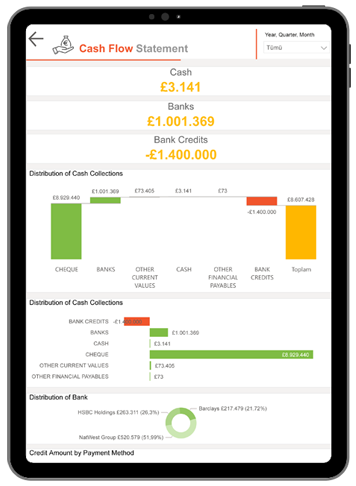

Our Payable/Credit reports collect your company information comprehensively, allowing you to view and analyze data and identify trends for all your suppliers, buyers and dimensions or payment terms. While maintaining the Customer/Vendor relationships, you can maintain tight cash outflow control, effectively manage the liquidity position, evaluate and improve the Customer/Vendor relationships from an Accounts Payable/Credit perspective, and evaluate functional transaction volumes and impact on AP performance. The goal here is to better manage your cash flow by getting quick information about your accounts payable, as cash flow is so important in the business world. Our solution not only provides a historical visualization of payments by groups, vendors, and currency, but also displays overdue amounts by Customer/Vendor and currencies. It has the experience and skills to help you gain the insights you need to effectively manage your organization's debts and receivables. The reports are designed to give you the flexibility to get a 360-degree view of your business and ask specific questions about your data.
You are heading towards a future where you cannot afford to miss the details of the data of your Sales Representatives. You must have the right tools to learn about risks and opportunities. Sales Representative has the feature to show you your potentials. The goal here is to provide valuable insights into the performance of your Sales Representatives and help senior executives make decisions based on this data and strategically plan the roadmap for the business future. Additionally, it allows users to conduct in-depth analysis of financial performance by location and product category. It provides a bird's-eye view of corporate information and business growth. It includes analysis of important data such as inventory, profit, revenue, performance, orders. It shows performance, orders, gross margin, actual revenue, target revenue, average failure rate, unplanned downtime, returns and cost values, and inventory statistics by month.

Contact with us
+44 (0) 7444 76 74 85
Fill out the form to receive information on Power BI Dashboard Solutions. We’ll get back to you within 1 business day
You can contact us for more information
Pargesoft has proved its success with many local and international projects;
- Local market leader in Microsoft Dynamics market with more than 100+ ERP projects.
- Has developed many Dynamics add-on solutions, such as project management, centralized dealer management, security industry management, mining industry management, manufacturing optimization, pay roll management, payment management.
- Has led many projects that integrate business process platforms, such as Sharepoint, and Microsoft ERP solutions.
- More than 10 B2B & B2C applications developments fully integrated with Microsoft Dynamics based on Microsoft .Net technologies.


